Smart pulse oximeter using Real-time Operating Systems and Machine Learning Techniques
With the advent of bio-medical technology in personal accessories has sparked the consciousness of individuals on their fitness and on-the-go health monitoring. Due to the prevailing pandemic situation, people are aware of the regular monitoring of vital physiological parameters, thus there is a trend observed as a sudden surge in demand for oximeters. Chip shortage was also observed during peak COVID-19 waves which has weakened the oximeters supply chain due to the unavailability of bio-medical application-specific integrated circuits (ASICs). Wearable health monitoring devices seems to be the future of vital physiological parameter measurement for personal and medical records. The proposed work involves the development of a wristworn pulse oximeter device embedded with powerful and precise algorithms for accurate SpO2 and pulse rate calculations. The current research project focus on the following areas, circuit and layout design for the realization of the printed circuit board (PCB), fabrication of PCB and assembly of electronic components, real-time operating system-based firmware development, and signal processing techniques for reliable calculations of the SpO2 and the pulse rate. Machine learning algorithm helps to observe the trends (such as an indication of sedentary behaviour) and thus, suggest measures to be taken for adopting a healthier lifestyle. Index Terms—pulse oximeter, SpO2 , pulse rate, biomedical, wearables
I. INTRODUCTION
For the survival of the tissues, oxygen is necessary. A patient suffers from hypoxia, in case of shortage of oxygen in tissues. Bright red appearance of tissues fades away and become dark red or look blue in a state of hypoxia. A quick damage to brain can happen due to interrupted supply of oxygen to tissues. Concentration of haemoglobin saturated with oxygen determines the colour of the blood. Arterial blood is bright red in colour and is fully saturated; venous blood is dark red in colour and has less oxygen. Heart is responsible to push arterial blood to the tissues. Haemoglobin is present in the capillary networks in each organ and exports oxygen to the tissues. Oxygen get utilized by the cell results in carbon dioxide foramtion, which is carried away by venous blood to the lungs and get excreted in the form of exhaled gas. Red blood cells carry oxygen in the form of haemoglobin. A term “saturated with oxygen” is described as when haemoglobin carries oxygen within itself. Venous blood delivers some of its oxygen to the tissues. Normally, 75% saturation with oxygen is present in haemoglobin of the venous blood. Lungs oxygenate the blood and deliver to the tissues by the action of heart pumping. Normally 98% of haemoglobin in arterial blood is saturated with oxygen. Pulse oximetry is termed as the non-invasive measurement of oxygen saturation in the blood. Oxygen saturation is defined as the amount of oxygen dissolved in the blood. It is based on the measurement of deoxyhaemoglobin (Hb) and haemoglobin (HbO2). Actual difference in the absorption spectra of HbO2 and Hb is measured for two different light wavelengths. Measurement of absorption coefficients uses wavelengths of 940 nm (infrared light spectra) and 660 nm (red light spectra). Oxygenated and deoxygenated haemoglobin in the blood cells absorb different wavelengths. Oxygenated haemoglobin absorbs more IR light and deoxygenated haemoglobin absorbs more red light. A photodetector based electronic cicuit is used to detect the transmitted (or non-absorbed) light from the red and IR LEDs. Received signal from photodetector is further decomposed into a DC component and an AC component, where AC component represents pulsatile behaviour of arterial blood and the DC component represents, the light absorbed by non-pulsatile blood.
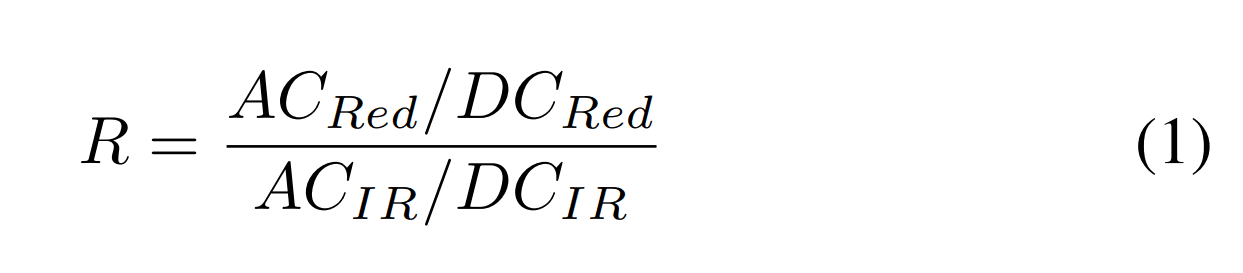
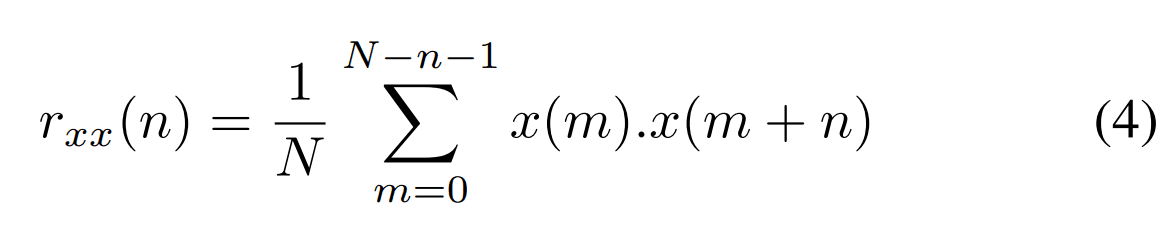
A function of the pulse oximeter is to analyze the absorption from the pulsatile-added volume of arterial blood and calculation of absorption ratio using the equation 1. SpO2 value is calculated using the R-value and sensor specific calibration data. Pulse is termed as pulsating behaviour of blood in artery, which occurs due to contraction of the left ventricle during a cardiac cycle. Due to the flow of blood in arteries because of periodic heart pumping, expansion and contraction happens in the arteries. Mathematical calculation of the said periodic behaviour is termed as pulse rate. The normal pulse rate ranges from 50 to 120 beats per minute for a healthy adult. Exercise, illness, injury and emotions may alter pulse rate.
II. LITERATURE SURVEY
A. Smart wearable systems: Current status and future challenges
The diversity of applicable fields for smart wearable systems corresponds with the various system architectures and components, from wristwatches to smart clothing for professionals. Authors have selected representative smart wearable systems that have been developed in academia or industry or that have been commercialized [1]. The SWS are presented according to their main features (e.g., electronic components, smart fabric, implantable).
B. Recent advances in wearable sensors and portable electronics for sleep monitoring
This report reviews the advances in wearable sensors, miniaturized electronics, and system packaging for home sleep monitoring [2]. New devices available in the market and systems are collectively summarized based on their overall structure, form factor, materials, and sleep assessment method. It is expected that this review provides a comprehensive view of newly developed technologies and broad insights into wearable sensors and portable electronics toward advanced sleep monitoring as well as at-home sleep assessment.
C. A pulse oximeter system, OxiSense, with embedded signal processing using an ultra-low power ASIC designed for testability
This paper presents a complete Internet of Things-enabled pulse oximeter system, called OxiSense, made using a customdesigned low power application specific integrated circuit (ASIC) for signal conditioning [3]. One of the novel aspects of the developed system is the testability of all the important modules of the ASIC (both analog and digital) using auxiliary circuits implemented in the ASIC. Another novel aspect is a new embedded and efficient signal-processing algorithm that is robust to small motion artifacts.
D. Miniaturized Battery-Free Wireless Systems for Wearable Pulse Oximetry
The authors report materials and device concepts for flexible platforms that incorporate advanced optoelectronic functionality for applications in wireless capture and transmission of photoplethysmograms, including quantitative information on blood oxygenation, heart rate, and heart rate variability [4]. Specifically, reflectance pulse oximetry in conjunction with near-field communication capabilities enables operation in thin, miniaturized flexible devices. Studies of the material enable aspects associated with the body interface, together with investigations of the radio frequency characteristics, the optoelectronic data acquisition approaches, and the analysis methods to capture all of the relevant engineering considerations. Demonstrations of operation on various locations of the body and quantitative comparisons to clinical gold standards establish the versatility and measurement accuracy of these systems, respectively.
E. Internet of Things-based wearable device to monitor the signs of quarantined remote patients of COVID-19
The proposed system is implemented with three layered functionalities, a wearable Internet of Things sensor layer, a cloud layer with an Application Peripheral Interface (API), and an Android web layer for mobile phones [5]. Each layer has individual functionality, first, the data is measured from the Internet of Things sensor layer to define the health symptoms. The next layer is used to store the information in the cloud database for preventive measures, alerts, and immediate actions. The Android mobile application layer is responsible for providing notifications and alerts for potentially infected patient family respondents.
F. System design for wearable blood oxygen saturation and pulse measurement device
Authors propose a near-infrared wearable device for blood oxygen saturation and heart rate using microprocessors in sports Internet of Things networks [6]. The measurement using near-infrared technology was done to collect the blood oxygen saturation and pulse parameters. After obtaining the two parameters, the portable device will send the data to the remote coaches or doctors via GPRS/Wi-Fi/Zigbee networks. The data of the blood oxygen saturation and the pulse that is detected by the detection module are processed by the expert decision-making system to provide the coaches and doctors with the athlete’s condition. 2.7. A Low-Power DynamicRange Relaxed Analog Front End for Wearable Heart Rate and Blood Oximetry Sensor.
This paper presents a low-power analog front end that enables PPG signal acquisition [7]. By implementing a highpass function, the ac and dc components of the PPG signal are separately extracted to calculate heart rate and oxygen saturation, and the dynamic range requirement of the readout channel is relaxed. In addition, the chopping modulation is implemented to ensure low-noise operation. The measurements show that the power consumption is approximately 180 µW at a supply of 2.5 V. The circuit achieves an input noise of 6.45 pArms. The analog front-end circuit is designed and fabricated in the CMOS 0.18-µm standard technology.
III. METHODOLOGY
A. IMPLEMENTATION
The purpose of this project is to eliminate analog front-end IC for the realization of pulse oximeters. a) LED driver design: To implement LED diver circuit design, critical things to be considered are the constant programmable current and switching operation. Switching operation In conventional ASIC, switching of both RED and IR LED is handled internally. In the proposed work, a 4-bit shift register is used. Bit 3 output is fed back to the Bit 0 position, thus making it a ring shift register. The clock needs to be given to the shift register in such a manner that it should be four times the desired sampling frequency of each LED. Functionality can be easily seen in figure 1. Figure 1:
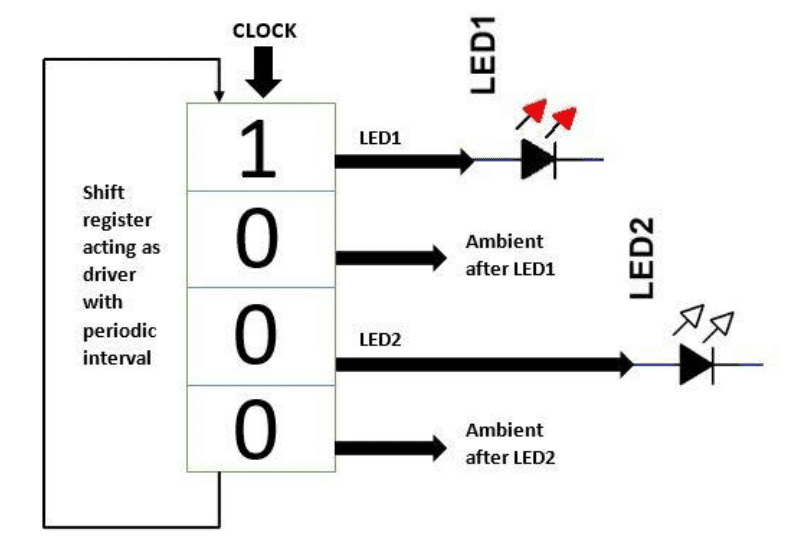
Fig. 1. LED driver switching functionality.
LED driver switching functionality Constant programmable current The basic circuit shown in figure 2 cannot be used because of the switching operation being performed in parallel. Op-amp will keep on trying to maintain the programmed current through the LED. Figure 2: LED current control
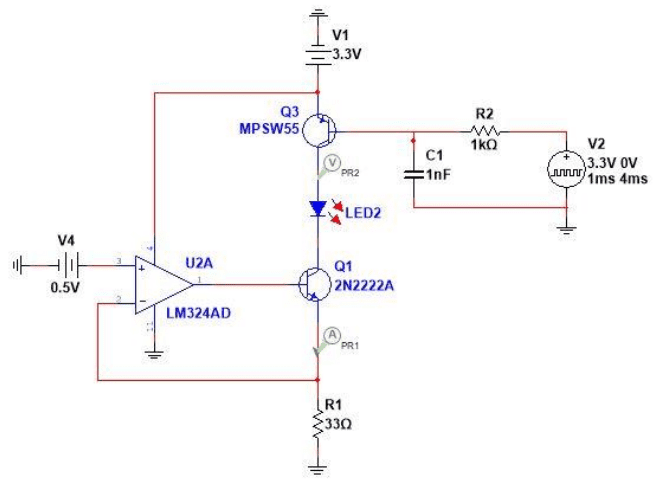
Fig. 2. LED current control conventional approach.
conventional approach Figure 3: Conventional current control approach result due to switching Figure 4: LED current control proposed approach Figure 5: Current control results using the proposed approach During switching, its feedback will result in maintaining a noisy peak of current through the LED
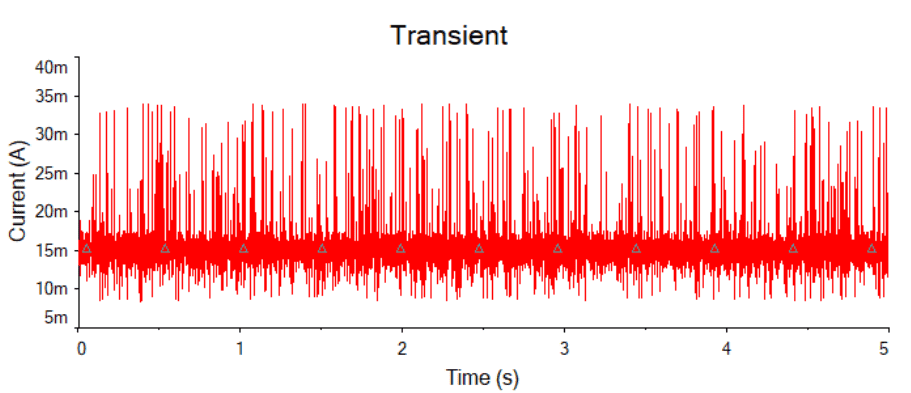
Fig. 3. Conventional current control approach result due to switching.
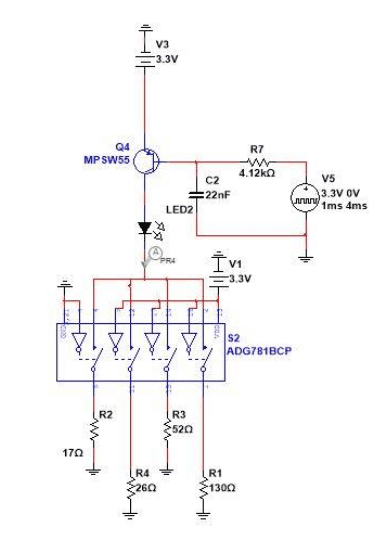
Fig. 4. LED current control proposed approach.
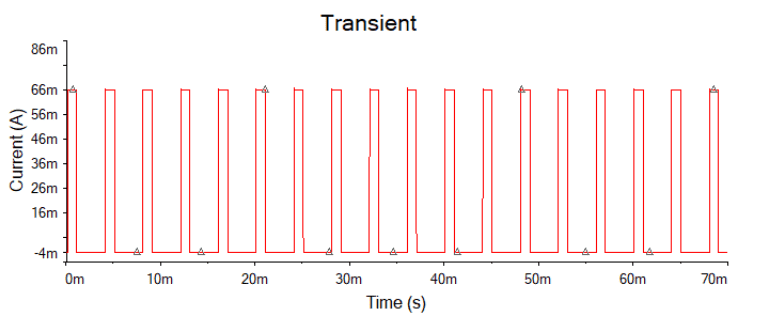
Fig. 5. Current control results using the proposed approach
as shown in figure 3. To avoid this noisy current behaviour through LED, we needed to think of a more basic solution in which feedback should not be involved. Thus, in place of opamp based current regulation, a quad SPST switch is placed and four resistances were put across them as shown in figure 4 and improved performance can be seen in figure 5. With the help of a microcontroller, we will be able to control the current through a single resistor switch enabled or with a combination of switches.
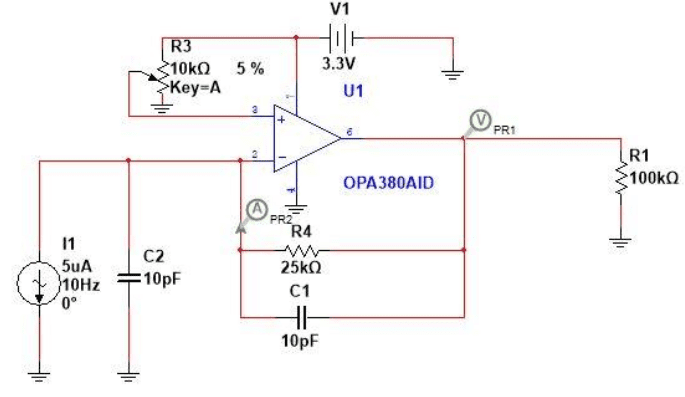
Fig. 6. Receiver circuit for photodiode.
b) Receiver circuit design: Figure 6: Receiver circuit for photodiode Figure 7: Output waveform for photodiode
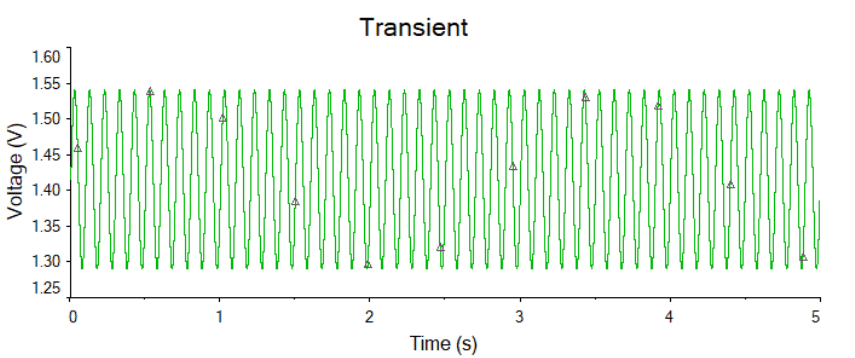
Fig. 7. Output waveform for photodiode circuit
circuit Figure 6 and figure 7 represent the implementation of the photodiode circuit. A low noise trans-impedance amplifier is used with a high gain bandwidth product of 1MHz. In the proposed design voltage at non-inverting input will be provided by the DAC of a microcontroller and in place of a feedback resistor digital rheostat is used to dynamically change the gain of the receiver circuit.
B. HARDWARE MODULES IN SMART PULSE OXIMETER
Proposed project focuses on removing the dependency on bio-medical application specific ICs and efforts is made towards making the system with lesser sophisticated ICs which are easily available and that on a cheaper price. It emphasise on the machine learning intelligence embedded in algorithms for smart performance. For a reliable hardware design, pulse oximeter has been equipped with 10 major hardware modules as shown in figure 8. OLED, Display, SWD, Debug Port, Power Section, Battery Monitoring, Switch, Photodiode, Analog Front End, LED Driver, Bluetooth, RTC, Microcontroller, Accelerometer.
C. DATA ACQUISITION AND FILTERING
Plethysmographic data consists of four parts named as IR signal data, ambient data followed by IR signal data, RED signal data, ambient data followed by red signal data. At a sampling frequency of 250 Hz, 1024 samples of each plethysmographic data is stored in individual buffers of float32 t data type in approximately 4 seconds of time duration. The maximum frequency component present in the plethysmographic data is 15.00 – 20.00 Hz. Acquired plethysmographic data is filtered using low pass IIR filter of 4 th order with a cutoff frequency of 25.00 Hz. Filter coefficients are derived using Filter designer GUI in signal processing toolbox of MATLAB. A screen display of filter designer GUI is shown in Figure 26. Figure 28: Filter design for PPG-IR and PPG-RED waveform for SpO2 calculation Filtered plethysmographic RED and IR waveform looks like Figure 29, where y-axis shows voltage in microvolts and x-axis shows sample number. Figure 29: PPG-
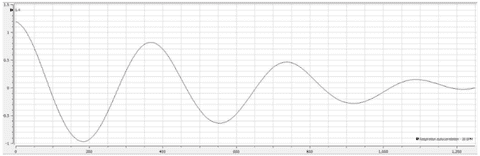
Fig. 8. PPG-IR and PPG-RED waveforms.
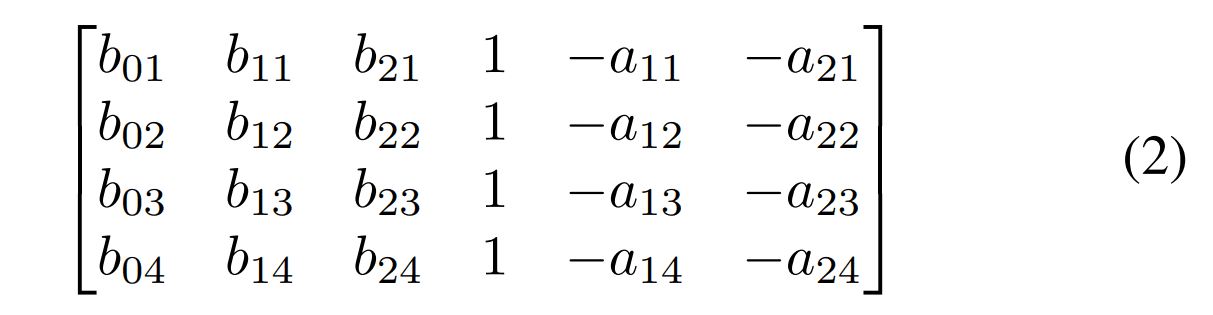
IR and PPG-RED waveforms Filter coefficients are derived for direct form 1 structure and are mentioned below in SOS matrix form: Generally used SOS matrix form is shown in equation 3.
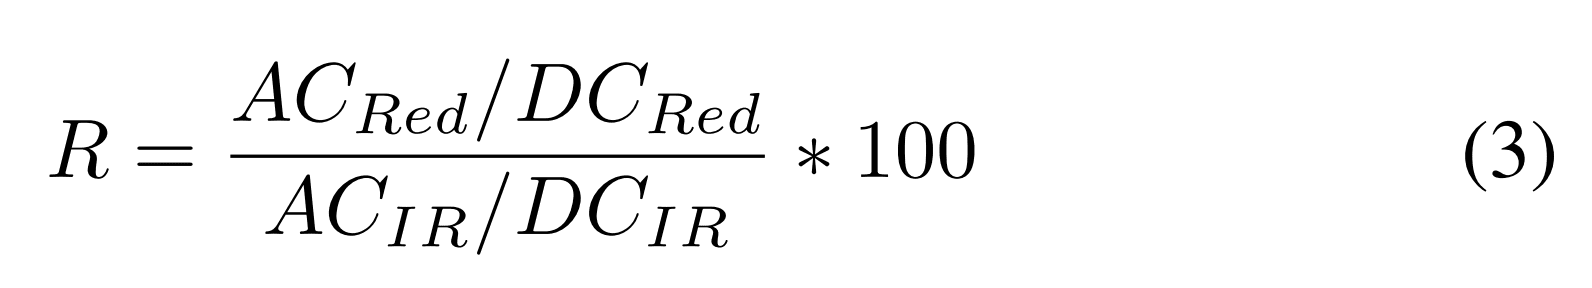
Here, the unit place subscript describes a section of the filter, and the tens place subscript describes a polynomial stage of a coefficient. Fast Fourier transform is used to calculate AC and DC components from the PPG signal using the arm rfft f32 function from arm math.h library. To efficiently calculate the FFT of PPG data, the sample buffer size is kept at 1024 (power of two). Upon obtaining the FFT of a signal, a maximum component of the AC component around the pulse rate component will be chosen. By taking the pulse rate frequency component in the middle maximum component will be taken within ± 4 frequency points. SpO2 value can be derived from R-value. R-value can be calculated by using equation 6.
During the calibration of a sensor, the FLUKE simulator has been used, with the following settings to be made in the simulator. For a given SpO2 value, R-value is recorded and kept in a look-up-table. During runtime, the SpO2 value from Rvalue is given from the look-up table. SpO2 shall be considered valid if its value falls within the range of 40% to 100%. The latest SpO2 value shall be compared with the previous three SpO2 values. The latest SpO2 value shall be stored in an array with the previous two SpO2 values only when two out of three differences the between latest SpO2 value and previous SpO2 values are less than 15. The final SpO2 value shall be the average of 3 SpO2 values. Autocorrelation is performed on PPG-IR data stored in buffer array to detect the repeated patterns in PPG-IR data. Autocorrelation formula is given in equation 10:
A typical waveform of autocorrelation output is shown in Figure 30. Figure 30: Autocorrelation output of PPG-IR
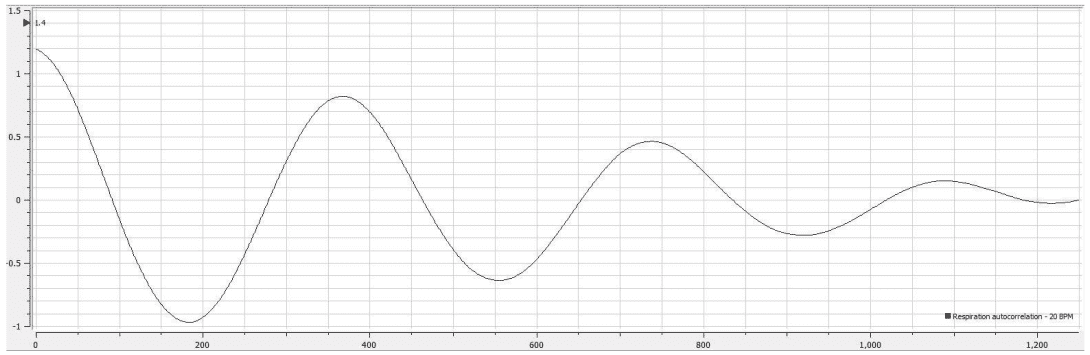
Fig. 9. Autocorrelation output of PPG-IR waveform.
waveform. Each peak in autocorrelation waveform represents the pattern recognition. Number of pulsating cycles shall be equal to number of peaks in autocorrelation output. Average interval between the peaks will give the pulse period. Samples of autocorrelation waveform qualify for peak detection when they cross certain threshold values. Hysteresis is introduced in threshold values to eliminate noise peaks near threshold points. To be a valid sample for peak detection, sample value should be more than 10% of the maximum autocorrelation value for positive slopes and less than 0 negative slopes on the waveform. Mean interval between the peaks is calculated after storing all the peaks of autocorrelation waveform and their positions in buffer array. Peaks intervals shall be considered only if they fall within 60% to 140% of the mean interval value to eliminate false peak intervals. All the qualified peak intervals shall be averaged to get the final peak interval for calculation of pulse rate. Pulse rate calculation and validation Pulse rate can be calculated from obtained average peak interval as shown in equation 11.

where, SAMPLING RATE = 250 Hz The pulse rate shall be considered valid if its value falls within the range of 40 bpm to 240 bpm. The latest PR value shall be compared with the previous three PR values. The latest PR value shall be stored in an array with the previous two PR values only when two out of three differences between the latest PR value and previous PR values are less than 15. The final PR value shall be the average of 3 PR values.
IV. RESULTS AND DISCUSSION
Successfully designed schematic and layout of the proposed design was given for fabrication to outside vendor by providing the necessary gerber files. Top and bottom layer of the assembled PCB is shown in figure 31. Figure 31: Top
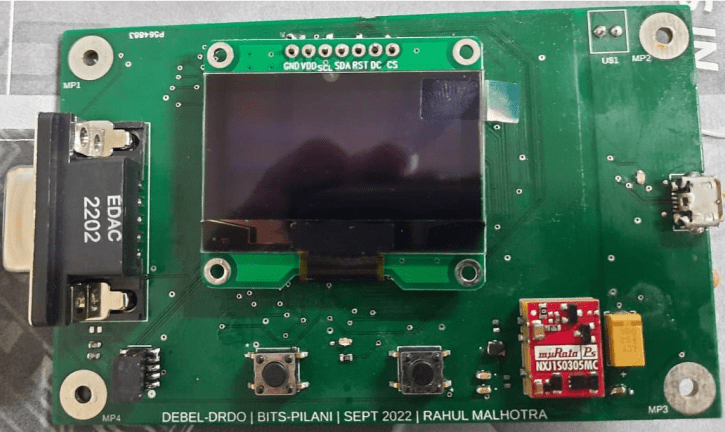
Fig. 10. Top view of assembled PCB.
view of assembled PCB Firmware development was carried out in Microchip Studio using GCC compiler. Flow chart representing the behavioral flow of the firmware as shown in figure 32. Figure 32: Flowchart for firmware during start-up
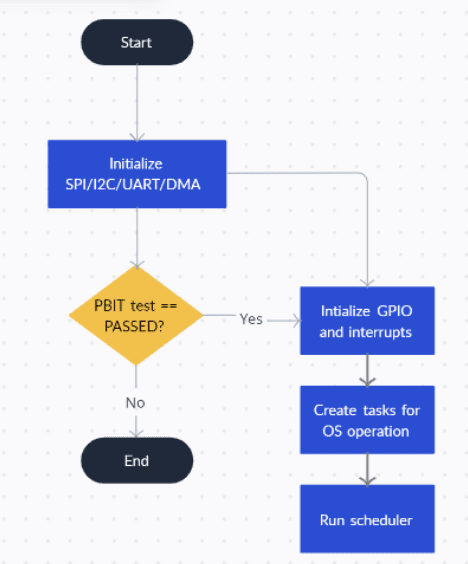
Fig. 11. Flowchart for firmware during start-up.
Algorithm firmware for SpO2 and pulse rate calculation can be seen in figure 33. SpO2 Pulse Rate Figure 33: Flowchart for SpO2 and pulse rate algorithms A real-time operating system is successfully implemented in the firmware. Overall functionality is divided into various tasks and is driven either using a polling method or with the usage of an interrupt handler as shown in figure 34. Figure 34: Task structure for RTOS implementation Due to power section issues, the board is not working as of now.
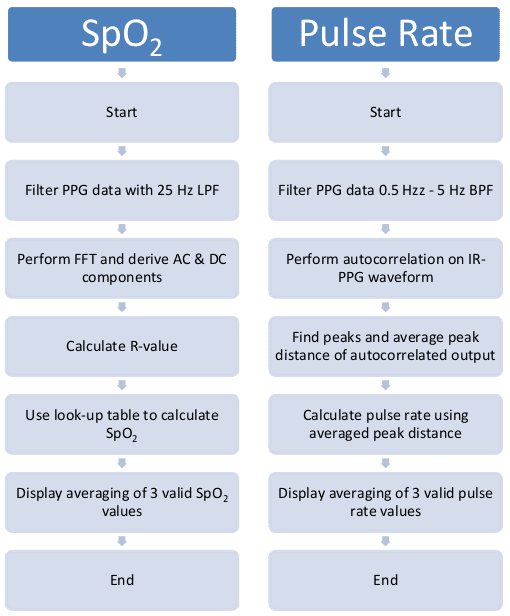
Fig. 12. Flowchart for SpO2 and pulse rate algorithms.
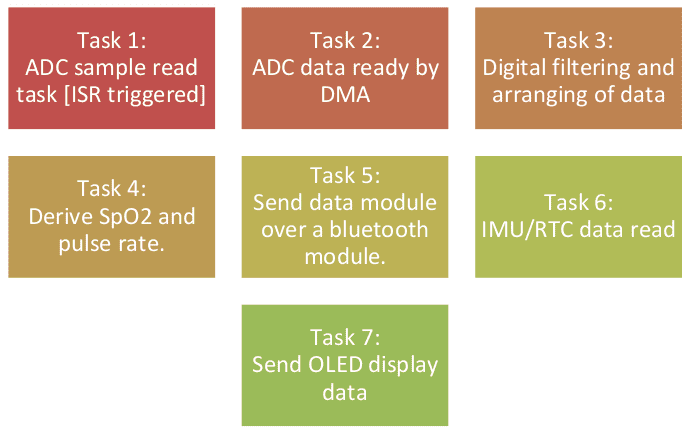
Fig. 13. Task structure for RTOS implementation.
Still need some time to debug. On the other hand, the firmware has been made for the development board of the same microcontroller. The picture shown in figure 35 shows the working model of the development board model design. Figure 35: Firmware development using development board Figure 36 shows the screenshot of the serial communication port displaying the data of pulse rate and SpO2 values. Figure 36: Screenshot of serial communicator for data communication to PC Data is captured and processed in the embedded domain and sent to the PC via Bluetooth. Received data in the PC is used to run and train the machine learning algorithm. Figure 37: Confusion matrix for the SVM classifier Figure 38: Confusion matrix for the KNN classifier Raw values of pulse rate were stored in excel sheet for prolonged period on a subject. It was manually labelled either as sedentary behaviour or non-sedentary behavior in 80% of the dataset. It then was given to classifier for its training. KNN and SVM classifiers were used to implement the algorithm. Screenshot
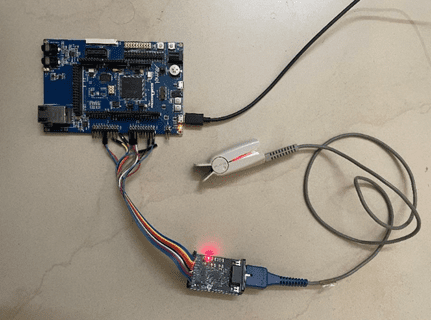
Fig. 14. Firmware development using development board.
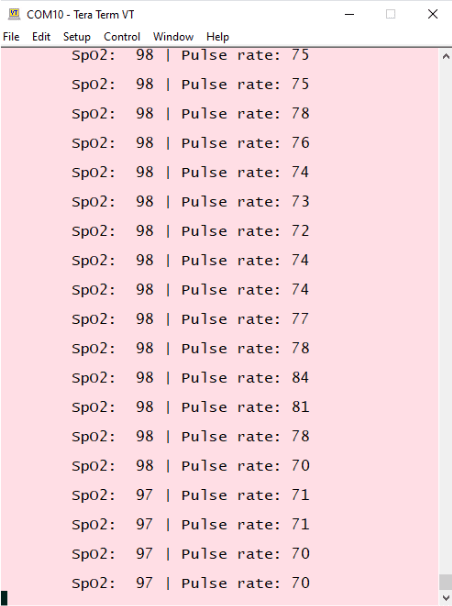
Fig. 15. Screenshot of serial communicator for data communication to PC.
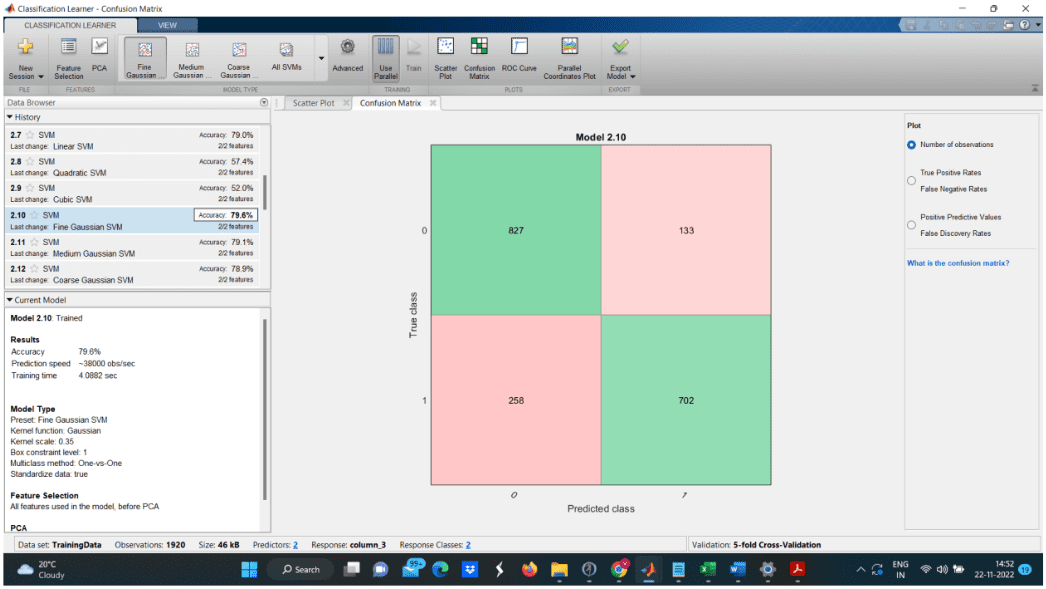
Fig. 16. Confusion matrix for the SVM classifier.
Fig. 17. Confusion matrix for the KNN classifier.
of PC screen running machine learning algorithm on given test data is shown in figure 35. Machine learning algorithm were tested on 20% of the testing data. It was found out that the SVM classifier shows the accuracy of 79.6% and the KNN classifier showed the accuracy of 79.3% for the detection of sedentary behaviour.
V. CONCLUSION
Proposed design was designed in MultiSim for simulation of circuit. For schematic and layout design was carried out in Fusion 360. Firmware development was carried out in Microchip studio. Data collected through serial plot using Tera Term software. Finally, MATLAB was used for data analysis and machine algorithm implementation for studying the sedentary behaviour. Proposed design shows its capabilities to implement SpO2 hardware implementation without using any ASIC provided by different OEMs. Firmware is designed to output value of SpO2 and pulse rate once in 4 seconds of interval. Digital filtering, autocorrelation, fast Fourier transfer techniques were used for the calculation of SpO2 and pulse rate. Data integrity was maintained using implementation of DMA interface. Processing of the data in microcontroller, new data acquisition of plethysmographic data was carried out simultaneously. Machine learning algorithm detects the sedentary and non-sedentary behaviour using the two classifier and show the accuracy of 79.6% and 79.3%.
A. Some Common Mistakes
• The word “data” is plural, not singular.
• The subscript for the permeability of vacuum µ0, and other common scientific constants, is zero with subscript formatting, not a lowercase letter “o”.
• In American English, commas, semicolons, periods, question and exclamation marks are located within quotation marks only when a complete thought or name is cited, such as a title or full quotation. When quotation marks are used, instead of a bold or italic typeface, to highlight a word or phrase, punctuation should appear outside of the quotation marks. A parenthetical phrase or statement at the end of a sentence is punctuated outside of the closing parenthesis (like this). (A parenthetical sentence is punctuated within the parentheses.)
• A graph within a graph is an “inset”, not an “insert”. The word alternatively is preferred to the word “alternately” (unless you really mean something that alternates).
• Do not use the word “essentially” to mean “approximately” or “effectively”.
• In your paper title, if the words “that uses” can accurately replace the word “using”, capitalize the “u”; if not, keep using lower-cased.
• Be aware of the different meanings of the homophones “affect” and “effect”, “complement” and “compliment”, “discreet” and “discrete”, “principal” and “principle”.
• Do not confuse “imply” and “infer”.
• The prefix “non” is not a word; it should be joined to the word it modifies, usually without a hyphen.
• There is no period after the “et” in the Latin abbreviation “et al.”.
• The abbreviation “i.e.” means “that is”, and the abbreviation “e.g.” means “for example”. An excellent style manual for science writers is [7].
B. Authors and Affiliations
The class file is designed for, but not limited to, six authors. A minimum of one author is required for all conference articles. Author names should be listed starting from left to right and then moving down to the next line. This is the author sequence that will be used in future citations and by indexing services. Names should not be listed in columns nor group by affiliation. Please keep your affiliations as succinct as possible (for example, do not differentiate among departments of the same organization).
C. Identify the Headings
Headings, or heads, are organizational devices that guide the reader through your paper. There are two types: component heads and text heads.
Component heads identify the different components of your paper and are not topically subordinate to each other. Examples include Acknowledgments and References and, for these, the correct style to use is “Heading 5”. Use “figure caption” for your Figure captions, and “table head” for your table title. Run-in heads, such as “Abstract”, will require you to apply a style (in this case, italic) in addition to the style provided by the drop down menu to differentiate the head from the text.
Text heads organize the topics on a relational, hierarchical basis. For example, the paper title is the primary text head because all subsequent material relates and elaborates on this one topic. If there are two or more sub-topics, the next level head (uppercase Roman numerals) should be used and, conversely, if there are not at least two sub-topics, then no subheads should be introduced.
D. Figures and Tables
a) Positioning Figures and Tables: Place figures and tables at the top and bottom of columns. Avoid placing them in the middle of columns. Large figures and tables may span across both columns. Figure captions should be below the figures; table heads should appear above the tables. Insert figures and tables after they are cited in the text. Use the abbreviation “Fig. 18”, even at the beginning of a sentence.

Fig. 18. Example of a figure caption.
Figure Labels: Use 8 point Times New Roman for Figure labels. Use words rather than symbols or abbreviations when writing Figure axis labels to avoid confusing the reader. As an example, write the quantity “Magnetization”, or “Magnetization, M”, not just “M”. If including units in the label, present them within parentheses. Do not label axes only with units. In the example, write “Magnetization (A/m)” or “Magnetization {A[m(1)]}”, not just “A/m”. Do not label axes with a ratio of quantities and units. For example, write “Temperature (K)”, not “Temperature/K”.
REFERENCES
In the current project, the literature inclined towards the new domain of smart wearable healthcare products and pulse oximetry systems is considered. The following are referred publications from the preliminary literature review.
[1] Chan, Marie, et al. ”Smart wearable systems: Current status and future challenges.” Artificial intelligence in medicine 56.3 (2012): 137-156.
[2] Kwon, Shinjae, Hojoong Kim, and Woon-Hong Yeo. ”Recent advances in wearable sensors and portable electronics for sleep monitoring.” Iscience 24.5 (2021): 102461.
[3] Das, Devarshi Mrinal, et al. ”A pulse oximeter system, OxiSense, with embedded signal processing using an ultra-low power ASIC designed for testability.” Microelectronics journal (2018): 1-10.
[4] Kim, J., et al. ”Miniaturized Battery-Free Wireless Systems for Wearable Pulse Oximetry.” Advanced Functional Materials, 27(1), 1604373, 2016.
[5] Al Bassam, Nizar, et al. ”IoT based wearable device to monitor the signs of quarantined remote patients of COVID-19.” Informatics in medicine unlocked 24 (2021): 100588.
[6] Fu, Yu, and Jian Liu. ”System design for wearable blood oxygen saturation and pulse measurement device.” Procedia manufacturing 3 (2015): 1187-1194.
[7] Zhang, Hao, and Ye Li. ”A low-power dynamic-range relaxed analog front end for wearable heart rate and blood oximetry sensor.” IEEE Sensors Journal 19.19 (2018): 8387-8392.